


Price forecast from 2 to 6 June 2025
In 2020, there were 31.2 million bloggers registered in the US. By 2025, we will most likely be dealing with a blogger state. And Trump still dreams that someone will be sewing high-tech jeans for him on a sewing machine in a factory.
For moderate self-admiration. Hello!
This release was prepared with the direct participation of analysts from trading platforms eOil.ru and IDK.ru. Here is an assessment of the situation on the global and Russian markets.
Energy market:
It is impossible to describe in words how subtle the thinking of OPEC+ members is. They decided to flood the market with oil. Well done, guys. They are the luminaries of the industry. There will be an increase of 411,000 barrels in July. And it seems that many are willing to live more simply for the sake of market share. That is, to postpone plans to conquer the galaxy in one area or another. For example, buying up all of Paris, which the Arabs are famous for.
It may become difficult for Russia to supply larger volumes of oil to foreign markets. Even if the country finds the capacity to increase supplies domestically, transporting these volumes may be physically difficult. Enemies never sleep. Therefore, on the one hand, we will see an increase in production by the cartel. On the other hand, there will be concern about the possibility of selling anything from Russia. We await with some anxiety whether there will be progress in the negotiations on Ukraine on June 2.
Grain market:
Soybeans did not want to grow, which could have been predicted earlier, looking at the fundamental indicators. The minor sentiment surrounding this oilseed and protein-rich crop served as a catalyst for corn, which chose to go downhill amid Brazil’s successes and the generally safe situation with heavy rains in the southern United States, which had previously caused concern. If the market finds no reason to grow, which is possible if Russia and Ukraine fail to show progress in negotiations, then we can expect an attempt to test 400.0 cents per bushel for corn.
Prices for Russian wheat in ports remain at good levels of $250 per ton. The situation can be considered stable. The downward trend in prices observed in April did not lead to anything. Overall, Russian wheat export volumes in May may decline significantly, almost twice or even more compared to last year, which should generally support FOB Novorossiysk prices due to reduced supply.
USD/RUB:
There is growing speculation in the press about a possible reduction in the Central Bank of Russia’s key rate at its meeting on June 6. Representatives of the relevant agencies have also mentioned a reduction. Overall, based on reports of a slowdown in weekly inflation, Nabiullina may make a symbolic gesture toward entrepreneurs by lowering the rate by 1%.
This is unlikely to be sufficient, but it will at least provide some incentive to wait until the next meeting for those who need money, but not at such an exorbitant price.
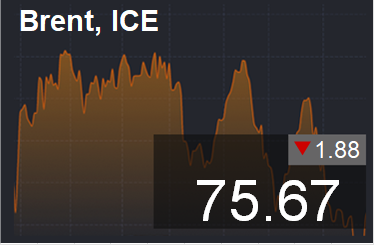
Brent. ICE
Let’s look at the open interest volumes for Brent. Keep in mind that this data is three days old (from Tuesday of last week) and is the most recent data published by the ICE exchange.
At present, asset managers have more open long positions than short ones. Over the past week, the difference between long and short positions of managers has decreased by 5,000 contracts. Both sides have been inactive in the market. Bulls remain in control.
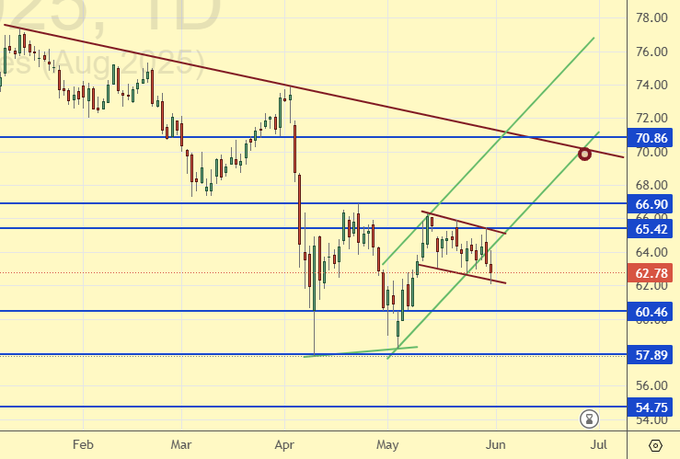
Growth scenario: switched to July futures, expiration date June 27. We continue to remain out of the market.
Fall scenario: there will likely be a dip to 70.80. We will use this to sell. Shorting from current positions is only interesting on the hourly chart.
Recommendations for the Brent crude oil market:
Purchase: no.
Sell: when approaching 70.80. Stop: 72.80. Target: 55.00.
Support – 60.46. Resistance – 65.42.
WTI. CME Group
Fundamental data for the US: the number of active drilling rigs decreased by 4 units and now stands at 461.
Commercial oil reserves in the US fell by -2.795 to 440.363 million barrels, against a forecast of +1 million barrels. Gasoline stocks fell by -2.441 to 223.081 million barrels. Distillate stocks fell by -0.724 to 103.408 million barrels. Stocks at the Cushing storage facility rose by 0.075 to 23.51 million barrels.
Oil production increased by 0.009 to 13.401 million barrels per day. Oil imports increased by 0.262 to 6.351 million barrels per day. Oil exports increased by 0.794 to 4.301 million barrels per day. Thus, net oil imports fell by -0.532 to 2.05 million barrels per day. Oil refining fell by -0.5 to 90.2 percent.
Demand for gasoline rose by 0.808 to 9.452 million barrels per day. Gasoline production rose by 0.19 to 9.751 million barrels per day. Gasoline imports rose by 0.008 to 0.755 million barrels per day. Gasoline exports fell by -0.357 to 0.626 million barrels per day.
Demand for distillates rose by 0.481 to 3.893 million barrels. Distillate production rose by 0.1 to 4.812 million barrels. Distillate imports fell by -0.027 to 0.114 million barrels. Distillate exports fell by -0.222 to 1.136 million barrels per day.
Demand for petroleum products rose by 0.211 to 20.242 million barrels. Production of petroleum products fell by -0.318 to 21.982 million barrels. Imports of petroleum products rose by 0.373 to 1.96 million barrels. Exports of petroleum products rose by 0.314 to 6.88 million barrels per day.
Demand for propane fell by -0.355 to 0.486 million barrels. Propane production rose by 0.021 to 2.854 million barrels. Propane imports fell by -0.014 to 0.066 million barrels. Propane exports rose by 0.459 to 2.149 million barrels per day.
Let’s look at the open interest volumes for WTI. Keep in mind that this data is three days old (from Tuesday of last week) and is the most recent data published by the CME Group.
At present, asset managers have more open long positions than short ones. Over the past week, the difference between long and short positions held by managers has narrowed by 7,900 contracts. There is virtually no activity on the market. Bets have been placed. There are no more bets. The bulls remain in control.
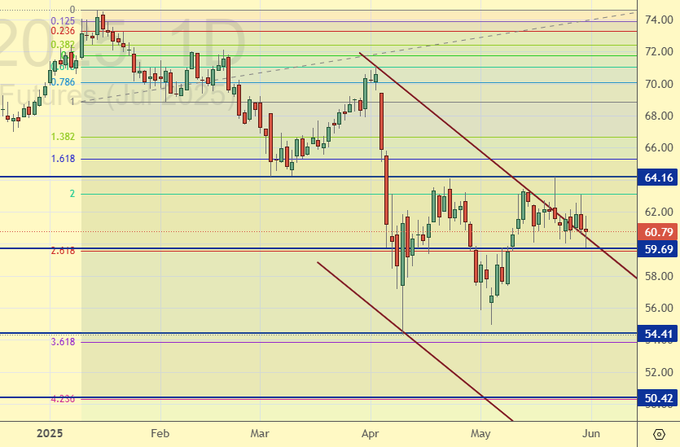
Growth scenario: considering July futures, expiration date June 20. Purchase is not interesting. Out of the market.
Fall scenario: knocked out of the short position. Currently out of the market. When approaching 68.00, we go short.
Recommendations for WTI crude oil:
Purchase: no.
Sell: when approaching 68.00. Stop: 70.00. Target: 53.00.
Support – 59.69. Resistance – 64.16.
Gas-Oil. ICE
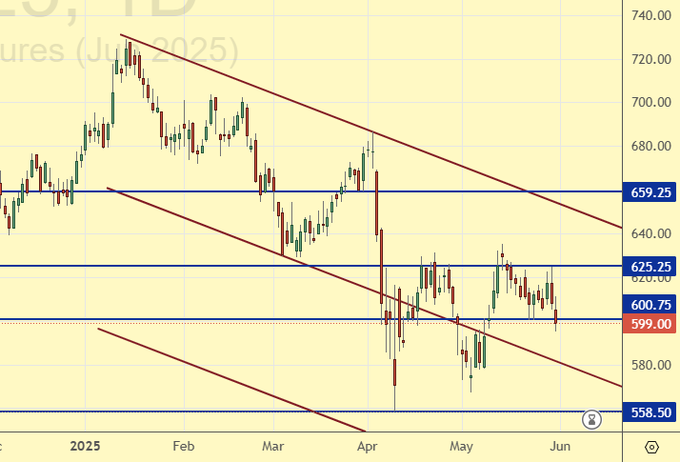
Growth scenario: considering June futures, expiration date June 11. No place to buy yet. Outside the market. Only when approaching 420.0.
Fall scenario: approaching 660.0 will open up a good opportunity for shorting.
Recommendations for Gasoil:
Purchase: when approaching 420.0. Stop: 390.0. Target: 600.0.
Sell: when approaching 660.0. Stop: 680.0. Target: 500.0.
Support – 558.50. Resistance – 625.25
Natural Gas. CME Group
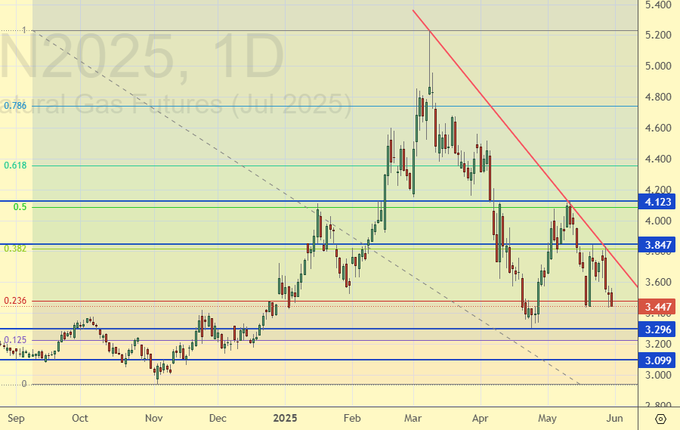
Growth scenario: switched to July futures, expiration date June 25. We will refrain from buying. Currently out of the market. Waiting for a breakout of the aggressive downward trend.
Fall scenario: we are not selling.
Recommendations for natural gas:
Purchase: not yet.
Sale: no.
Support – 3.296. Resistance – 3.847.
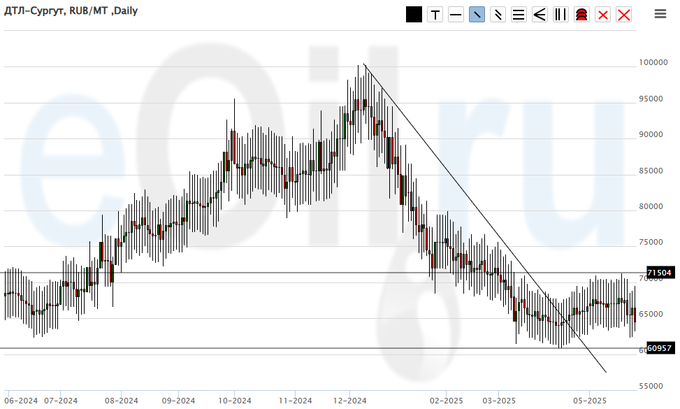
Diesel arctic fuel, ETP eOil.ru
Growth scenario: we continue to recommend buying. Bad things are happening with the budget. Fuel will be taxed (hypothesis).
Fall scenario: we will not sell anything. There is a constant risk of sudden price increases.
Recommendations for the diesel market:
Purchase: possible. Those in the 64,000 position, maintain a stop at 59,000. Target: 120,000.
Sale: no.
Support – 60,957. Resistance – 71,504.
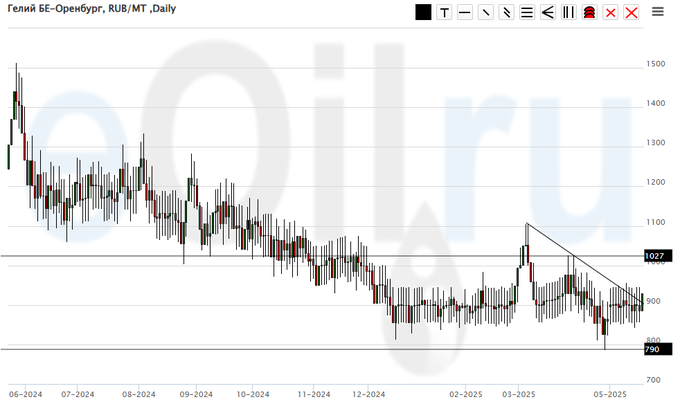
Helium (Orenburg), ETP eOil.ru
Growth scenario: we expect growth above 1100. A sad market. It is possible that prices will begin to take inflation into account in the future.
Fall scenario: we remain out of the market, prices are low.
Recommendations for the helium market:
Purchase: consider after growth above 1100.
Sale: no.
Support – 790. Resistance – 1027.
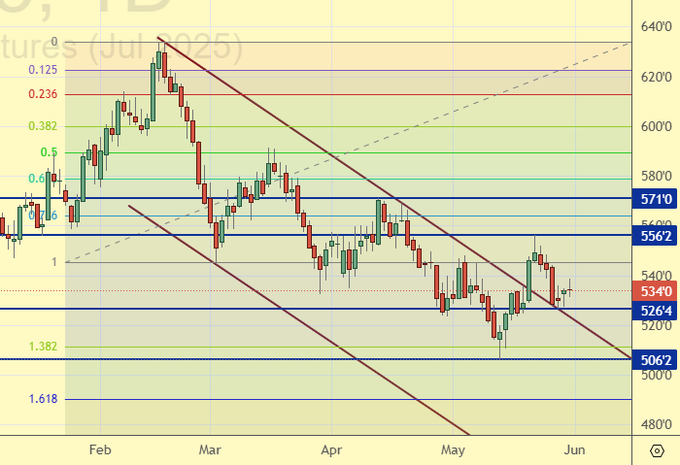
Wheat No. 2 Soft Red. CME Group
Let’s look at the open interest volumes for Wheat. Keep in mind that this data is three days old (from Tuesday of last week) and is the most recent data published by the CME Group exchange.
At present, asset managers have more open short positions than long ones. Over the past week, the difference between long and short positions held by managers has narrowed by 6,700 contracts. Sellers continued to exit the market, but buyers did the same, albeit less actively. Bears remain in control.
Growth scenario: considering the July contract, expiry date July 14. No desire to buy due to the flow of positive forecasts for gross revenue. Out of the market.
Fall scenario: a somewhat discouraging upward flight. Out of the market.
Recommendations for the wheat market:
Purchase: no.
Sale: no.
Support – 526.4. Resistance – 556.2.
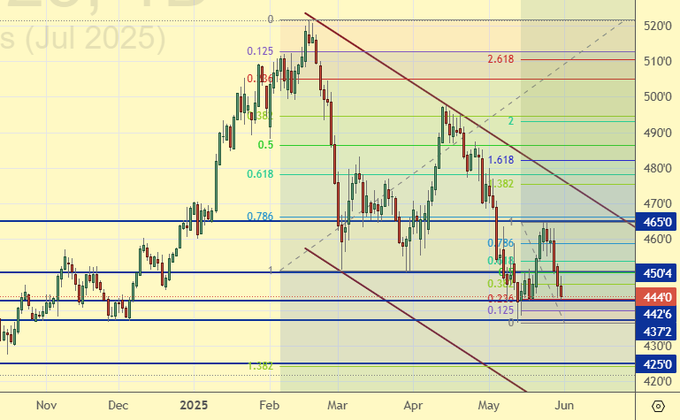
Corn No. 2 Yellow. CME Group
Let’s look at the open interest volumes for corn. Keep in mind that this data is three days old (from Tuesday of last week) and is the most recent data published by the CME Group.
At the moment, asset managers have more open short positions than long ones. The bears have taken control! Over the past week, the difference between long and short positions of managers has decreased by 5,300 contracts. Sellers left the market slightly faster than buyers. Speculators are not interested in rates. The bears have tightened their grip!
Growth scenario: switched to the July contract, expiry date July 14. For now, we need to be patient and wait. We will definitely buy, but not now.
Fall scenario: keep short positions. And wait. I want 300.0.
Recommendations for the corn market:
Purchase: no.
Sell: no. If you are in a position at 459.0, move your stop to 463.0. Target: 300.0?!!!
Support – 442.6. Resistance – 450.4.
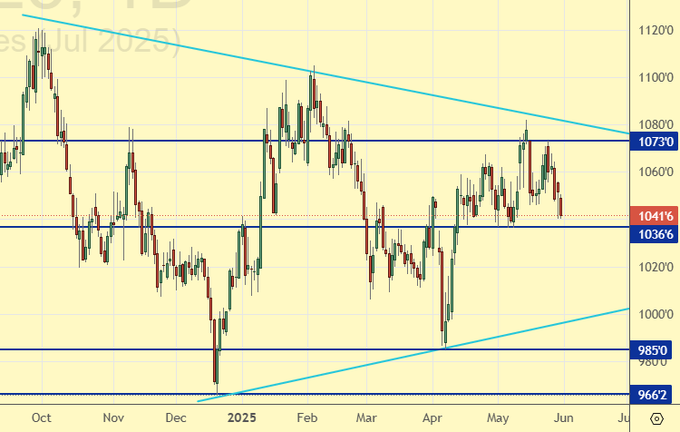
Soybeans No. 1. CME Group
Growth scenario: we are considering the July contract, expiry date July 14. Currently out of the market.
Fall scenario: we will continue to hold short positions. Soybeans should decline.
Recommendations for the soybean market:
Purchase: no.
Sell: no. Those in position at 1060.2, move your stop to 1080.0. Target: 840.0?!
Support – 1036.6. Resistance – 1080.4.
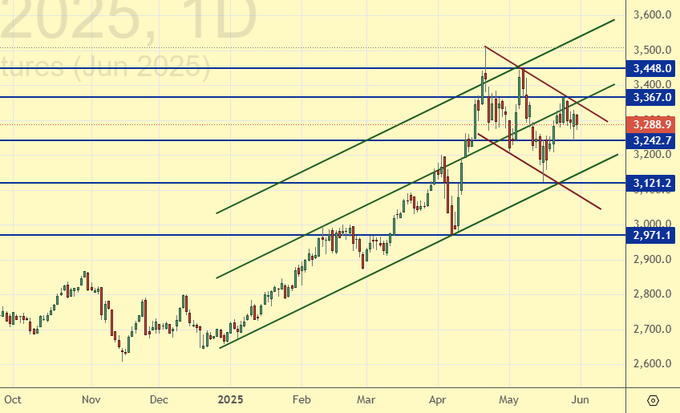
Growth scenario: considering June futures, expiration date June 26. The situation remains balanced. Outside the market.
Fall scenario: out of the market.
Gold market recommendations:
Purchase: no.
Sale: no.
Support – 3242. Resistance – 3367.
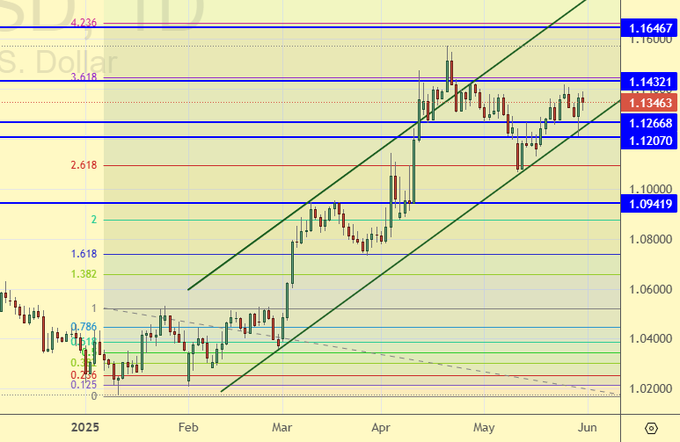
EUR/USD
Growth scenario: a purchase above 1.1450 is possible, but it is better to work it out on the charts.
Fall scenario: bears have no prospects for now. Out of the market. From 1.1650, you can go short.
Recommendations for the euro/dollar pair:
Purchase: no.
Sell: consider when approaching 1.1650.
Support – 1.1207. Resistance – 1.1432.
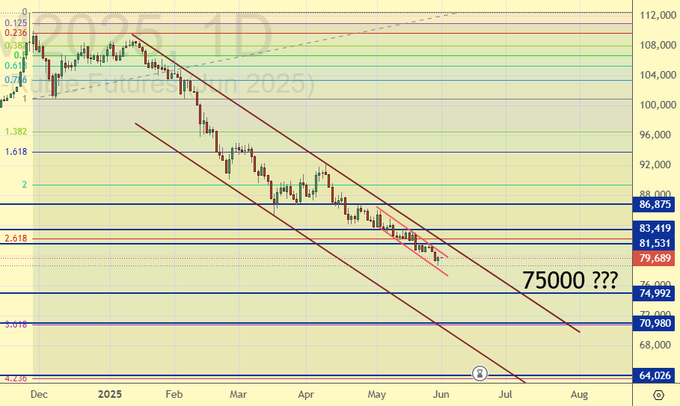
USD/RUB
Growth scenario: we are looking at June futures, expiry date June 19. Nothing new. A reversal is needed to enter a long position.
Fall scenario: selling is uncomfortable. We are looking for opportunities in other markets.
Recommendations for the dollar/ruble pair:
Purchase: in case of growth above 83,500. Stop: 81,500. Target: 115,000. Consider the risks.
Sale: no.
Support – 74,992. Resistance – 81,531.
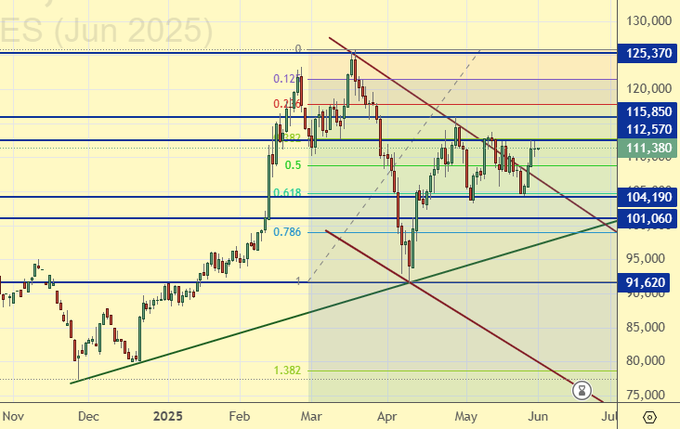
RTSI. MOEX
Growth scenario: we are considering June futures with an expiration date of June 19. We are maintaining flexibility. Monday’s negotiations on Ukraine are unpredictable. There will be no recommendations to buy.
Fall scenario: keep short positions. The economic outlook does not look promising.
Recommendations for the RTS Index:
Purchase: no.
Sell: no. Those in positions between 115,300 and 114,500 should maintain a stop at 114,200. Target: 80,000 (60,000).
Support – 104,190. Resistance – 115,850.
The recommendations in this article are NOT a direct guide for speculators and investors. All ideas and options for working on the markets presented in this material do NOT have 100% probability of execution in the future. The site does not take any responsibility for the results of deals.
