


Price forecast from 28 April to 2 May 2025
I turned over the hourglass, and immediately felt as powerful as the scientists of the United States. I, too, can control time and space. The downside is that I don’t give press conferences, or I could wow the world too. Then there’s the fridge magnets, they open the door to levitation. And so on.
Here’s to clear heads. Hello!
This release was prepared with the direct participation of analysts from trading platforms eOil.ru and IDK.ru. Here is an assessment of the situation on the global and Russian markets.
Energy market:
Of course, we are following the negotiation process between Russia, the United States and Ukraine. There is a positive wandering somewhere close by, and everyone wants to see it. We can’t see anything yet, but it’s here somewhere. We need to catch it by the long ears, pull it out of the box and show it to the people. In the meantime, there’s still a chance that the sanctions will be extended and expanded. Let’s wait and see.
The mood of some cartel members remains belligerent in terms of their desire to increase production and withdraw from the agreement. Because of Trump’s new duties, some states, including oil exporters, are likely to receive more modest currency revenues in the long run, which will lead to budgeting problems. This may provoke a desire to increase production and close the hole. For all oil exporters, the demarches of individual countries and uncontrolled increase in production may cost them dearly. The price will fall.
India and Pakistan are oil importers. And India takes 5.8 million barrels a day from the market every day and it is possible that this country will need even more if it has to fight full-scale hostilities with its neighbor. Initially, demand should increase. This may support the market, but in the long run the involvement of such a large country in the conflict may weaken it. The reaction of oil prices to the India-Pakistan conflict will depend on how far into the future the market looks. Whether it looks at the current circumstances or will “think” ahead. If forward looking, oil prices will fall.
Grain market:
The world is anxiously watching the rising tensions between India and Pakistan. India has blocked the Indus River, which will cause a drought in Pakistan, followed by flooding if there is a sudden release of water. India and Pakistan are actively buying food, including wheat, which may support prices on the market, as in case of the conflict expansion on part of the territories it will be impossible to farm.
Russia has been making money on wheat shipments to Pakistan. India has taken mainly peas from Russia in recent years. It is not excluded that wheat supplies to India will be resumed, after a 5-year break, as both countries may be weakened due to the active phase of hostilities. Note that this is out of the question for now, but things are very subtle there. Very. They’re already shooting.
Forecasts for the wheat harvest in Russia continue to compete in their modesty. If a week ago there were estimates of the lower boundary of 79 million tons, now they are not shy to speculate about the gross harvest, in case of bad weather conditions, in the amount of 78 million tons.
USD/RUB:
The Central Bank of Russia left the rate at 21%. Judging by the press conference, which was strictly calibrated, everything is aimed at creating a sense of control. As long as people enjoy the 20% deposit rate, we are unlikely to see any inflation shocks. But assuming prices continue to rise at the current rate, that’s when the question of what to do next comes up. Either to kill the real sector, keeping the cost of money at a high level, or to go the way of Turkey and sharply reduce interest rates for six months, saving the construction industry and the rest that is still somehow moving. True, the consequences of such a step will be even more devastating. But, it is not an attempt.
And so there is still preferential lending, but it cannot last too long. There are not enough benefits for everyone. Preferential lending is the same issue of money, just from a different angle. The government pays the difference in interest. And they’re taking it out of thin air right now.
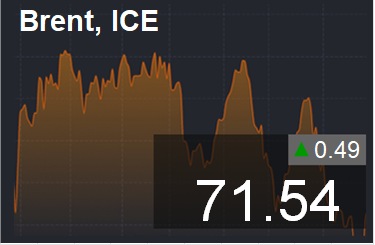
Brent. ICE
Let’s look at the open interest volumes for Brent. You should take into account that this is three days old data (for Tuesday of last week), and it is also the most recent data published by the ICE exchange.
At the moment there are more open long positions of asset managers than short ones. Over the past week the difference between long and short positions of asset managers increased by 24.7 th. contracts. We saw the outflow of sellers from the market. There were no buyers. Bulls keep control.
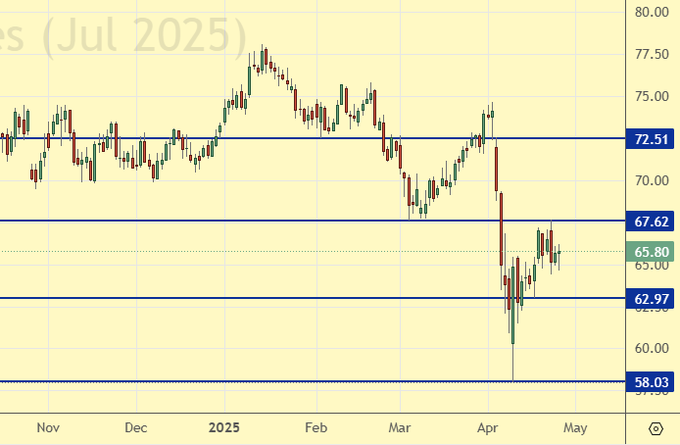
Growth scenario: moved to June futures, expiration date May 29. Difficult to forecast. Too much politics. Global bull market should be thought about only after growth above 75.00.
Downside scenario: continue to hold shorts.
Recommendations for the Brent oil market:
Buy: no.
Sell: no. Who is in the position from 72.51 and 71.10 (taking into account the transition to a new contract), move the stop to 71.60. Target: 54.70
Support — 62.97. Resistance — 67.62.
WTI. CME Group
US fundamental data: the number of active rigs rose by 2 units to 483.
U.S. commercial oil inventories rose by 0.244 to 443.104 million barrels, against a forecast of +1.6 million barrels. Gasoline inventories fell by -4.476 to 229.543 million barrels. Distillate stocks fell -2.353 to 106.878 million barrels. Cushing storage inventories fell by -0.086 to 25.019 million barrels.
Oil production fell by -0.002 to 13.46 million barrels per day. Oil imports fell by -0.412 to 5.589 million barrels per day. Oil exports fell by -1.551 to 3.549 million barrels per day. Thus, net oil imports rose by 1.139 to 2.04 million barrels per day. Oil refining rose by 1.8 to 88.1 percent.
Gasoline demand increased by 0.952 to 9.414 million barrels per day. Gasoline production increased by 0.661 to 10.073 million barrels per day. Gasoline imports rose 0.327 to 0.858 million barrels per day. Gasoline exports fell -0.179 to 0.675 million barrels per day.
Distillate demand rose by 0.045 to 3.903 million barrels. Distillate production fell -0.062 to 4.626 million barrels. Distillate imports fell -0.005 to 0.097 million barrels. Distillate exports fell -0.041 to 1.156 million barrels per day.
Demand for petroleum products increased by 1.752 to 20.875 million barrels. Production of petroleum products increased by 1.707 to 22.131 million barrels. Petroleum product imports rose 0.971 to 2.186 million barrels. Exports of refined products fell by -0.454 to 6.435 million barrels per day.
Propane demand fell by -0.613 to 0.448 million barrels. Propane production rose by 0.091 to 2.835 million barrels. Propane imports fell -0.002 to 0.097 million barrels. Propane exports rose 0.195 to 2.161 million barrels per day.
Let’s look at the WTI open interest volumes. You should take into account that this is three-day old data (for Tuesday of last week), and it is also the most recent data published by the CME Group exchange.
At the moment there are more open long positions of asset managers than short ones. Over the past week, the difference between long and short positions of asset managers increased by 51.8 thousand contracts. This is a big change. Sellers were leaving the market. Buyers arrived in small numbers. The bulls have stepped up their control.
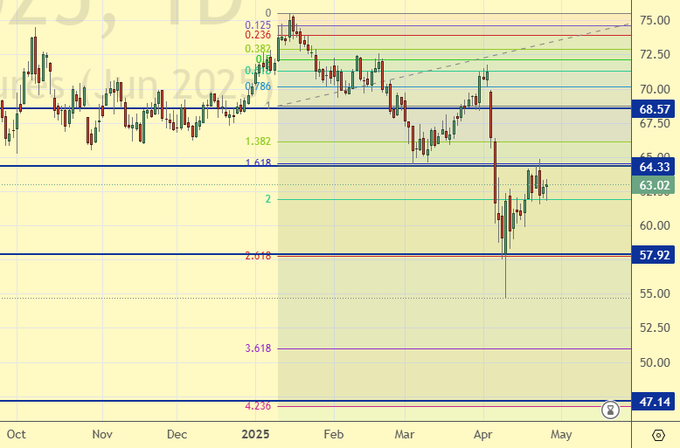
Growth scenario: moved to June futures, expiration date May 20. Buying is not interesting yet. Out of the market.
Downside scenario: we will continue to hold the short.
Recommendations for WTI crude oil:
Buy: no.
Sell: no. Who is in position from 69.72 and 68.00, move the stop to 68.80. Target: 47.30 (revised).
Support — 57.92. Resistance — 64.33.
Gas-Oil. ICE
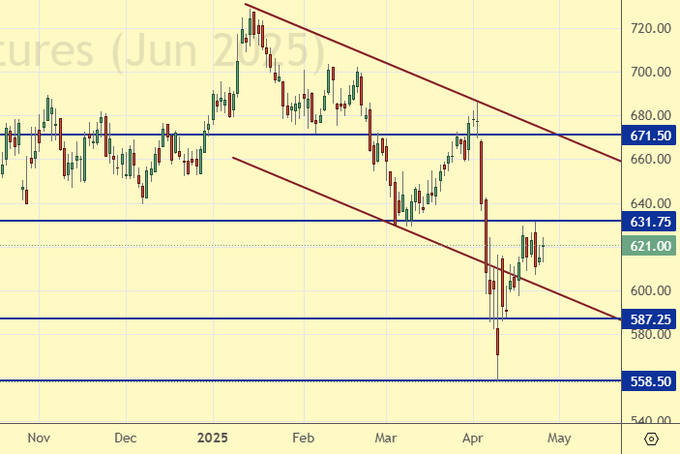
Growth scenario: moved to June futures, expiration date June 11. Nowhere to buy. Out of the market.
Downside scenario: we will continue to hold the short. Growth above 700.0 is needed to change sentiment to bullish.
Gasoil Recommendations:
Buy: when approaching 420.0. Stop: 390.0. Target: 600.0.
Sell: on approach to 670.0. Stop: 680.0. Target: 420.0. Those who are in positions from 688.0 and 677.0, move the stop to 665.0. Target: 420.00.
Support — 587.25. Resistance — 631.75
Natural Gas. CME Group
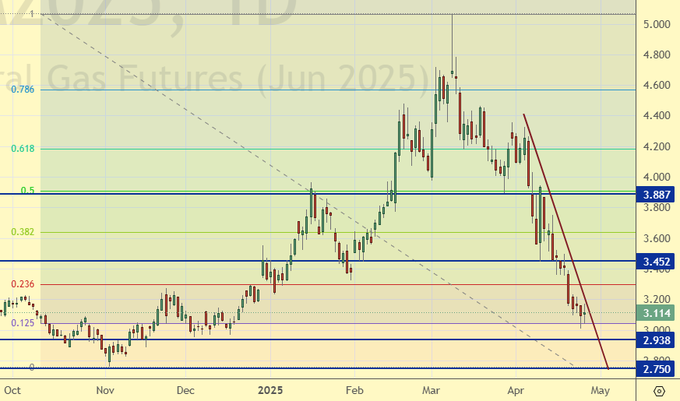
Growth scenario: moved to June futures, expiration date May 28. This is a good place to buy. Gas storage facilities in Europe are empty.
Downside scenario: we have come to the area where we can take profits. That’s what we’ll do. We do not open new sales.
Natural Gas Recommendations:
Buy: now (3.114). Stop: 2.890. Target: 6.000?!!!
Sale: no.
Support — 2.938. Resistance — 3.452.
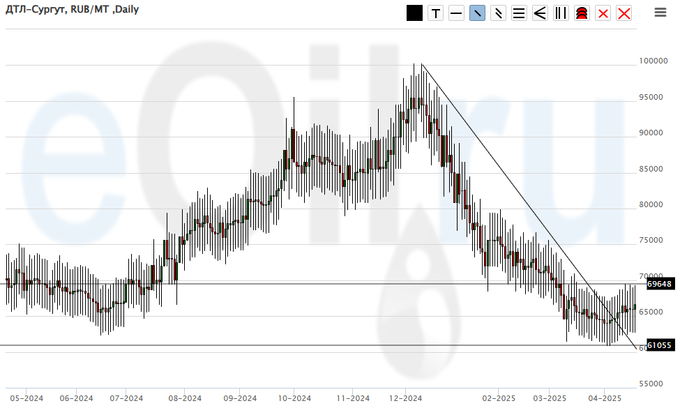
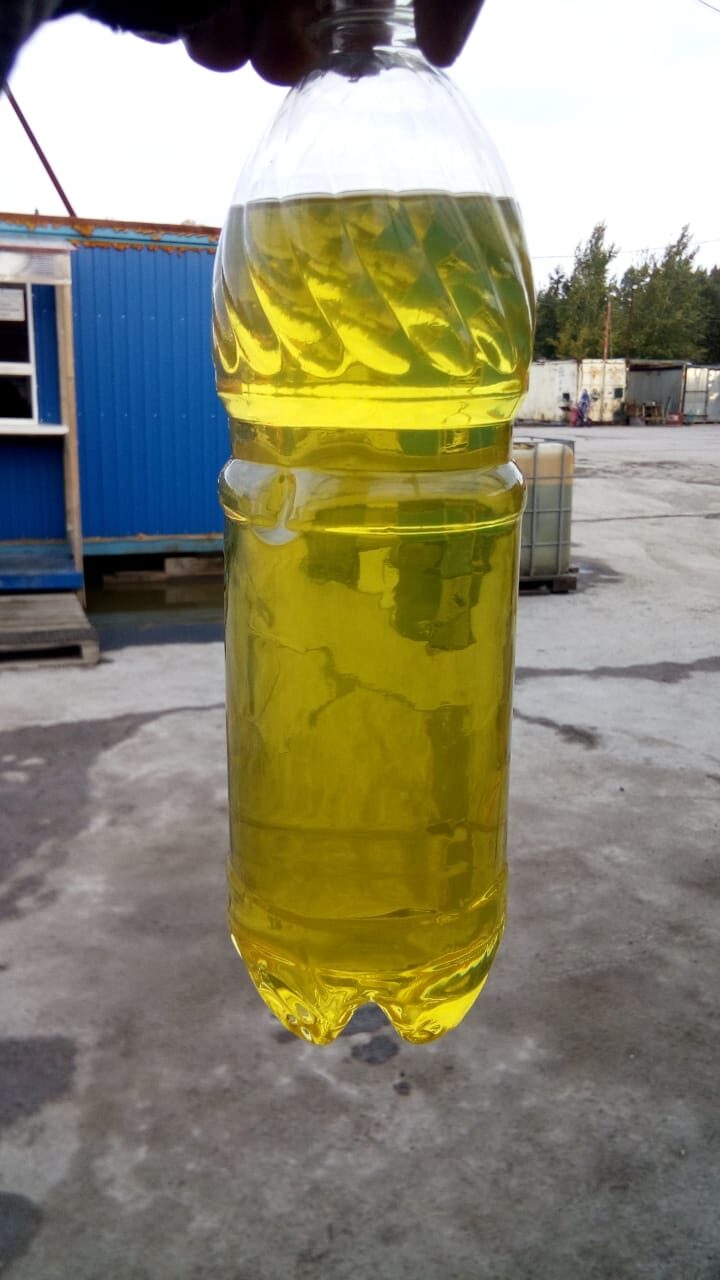
Diesel arctic fuel, ETP eOil.ru
Growth scenario: you can buy. Bad things are happening to the budget. Fuel will be taxed (hypothesis).
Downside scenario: we will not sell anything. There is a constant risk of a sudden rise in prices.
Diesel Market Recommendations:
Buy: possible. Who is in position from 64000, keep stop at 59000. Target: 120000.
Sale: no.
Support — 61055. Resistance — 69648.
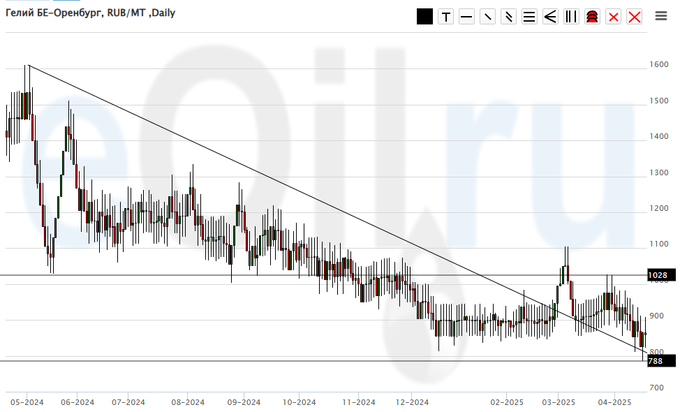
Helium (Orenburg), ETP eOil.ru
Growth scenario: knocked out of longing. Now we are waiting for growth above 1100. Sad market.
Downside scenario: stay out of the market, prices are low.
Helium market recommendations:
Buy: think after rising above 1100.
Sale: no.
Support — 788. Resistance — 1028.
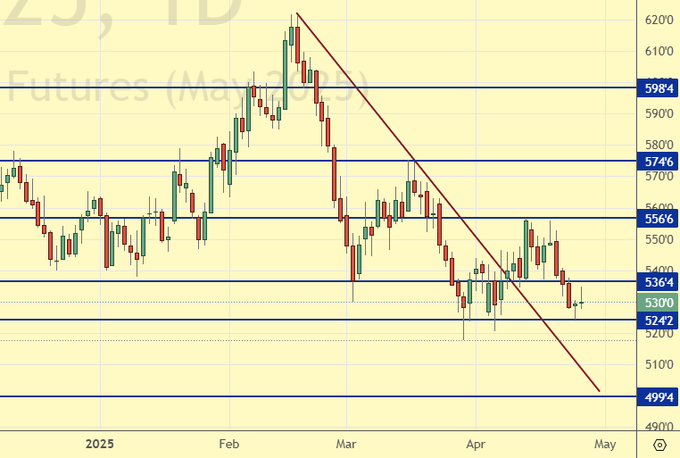
Wheat No. 2 Soft Red. CME Group
Let’s look at the volumes of open interest in Wheat. You should take into account that this is three days old data (for Tuesday of last week), but it is also the most recent data published by CME Group.
At the moment there are more open short positions of asset managers than long ones. During the past week the difference between long and short positions of asset managers decreased by 4.4 th. contracts. A small inflow of buyers during the week and lack of ideas from sellers. Bears are controlling the situation.
Growth scenario: we consider the May contract, expiration date May 14. Yes. You can buy from current levels.
Downside scenario: no interest in selling.
Recommendations for the wheat market:
Buy: now (530.0). Stop: 520.0. Target: 700.0.
Sale: no.
Support — 524.2. Resistance — 536.4.
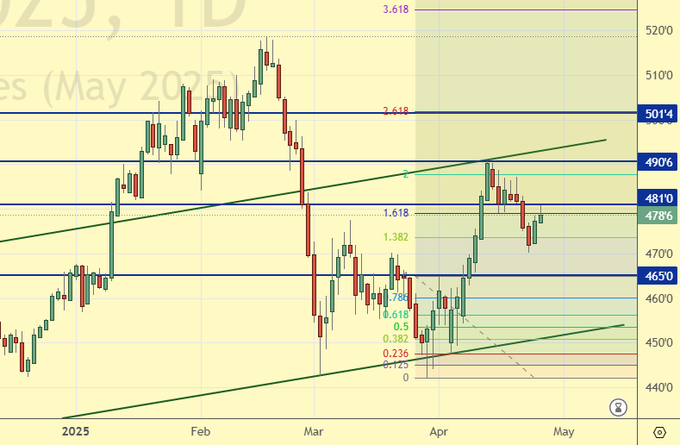
Corn No. 2 Yellow. CME Group
Let’s look at the volumes of open interest in Corn. You should take into account that this data is three days old (for Tuesday of last week), it is also the most recent of those published by the CME Group exchange.
At the moment there are more open long positions of asset managers than short ones. During the past week the difference between long and short positions of asset managers decreased by 12.7 th. contracts. Sellers arrived on the market, buyers also entered positions, but in smaller volumes. Bulls keep control.
Growth scenario: we consider May contract, expiration date May 14. Buy only on pullbacks.
Downside scenario: you can keep shorts, but don’t give much space to the market.
Recommendations for the corn market:
Buy: on a pullback to 461.0. Stop: 455.0. Target: 500.0.
Sell: No. Who is in position from 482.2, move your stop to 483.2. Target: 380.0?!
Support — 465.0. Resistance — 481.0.
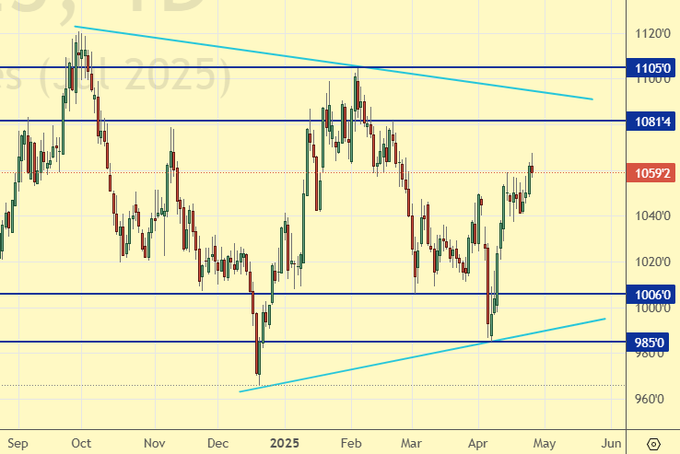
Soybeans No. 1. CME Group
Growth scenario: switched to July contract, expiration date July 14. A pullback to 1010.0 can be used for long entry. It is difficult to buy from current levels.
Downside scenario: it will be difficult to grow further. A small short is possible.
Recommendations for the soybean market:
Buy: on a pullback to 1010.0. Stop: 990.0. Target: 1200.0?
Sell: Now (1059.2). Stop: 1072.0. Target: 880.0
Support — 1006.0. Resistance — 1081.4.
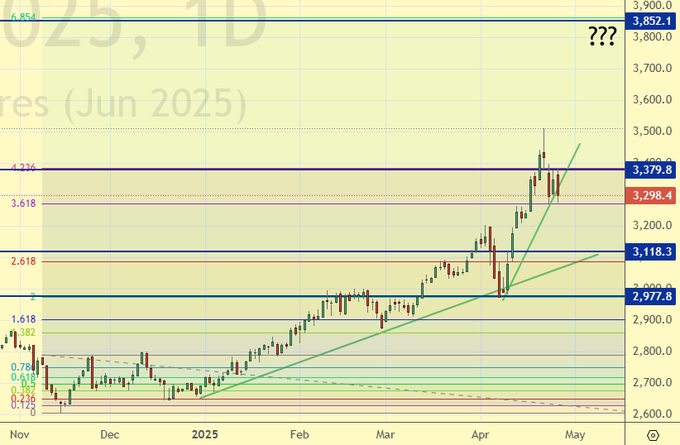
Growth scenario: we consider the June futures, expiration date June 26. Gold may continue to rally due to the conflict between India and Pakistan. The world is not getting better.
Downside scenario: it is difficult to go down. If we do move down, look for confirmation to enter short, for example, we need to go below 3250.
Gold Market Recommendations:
Buy: now (3298.4). Stop: 3240. Target: 3850.
Sell: after falling below 3250. Stop: 3353. Target: 3000. Consider the risks!
Support — 3118. Resistance — 3379.
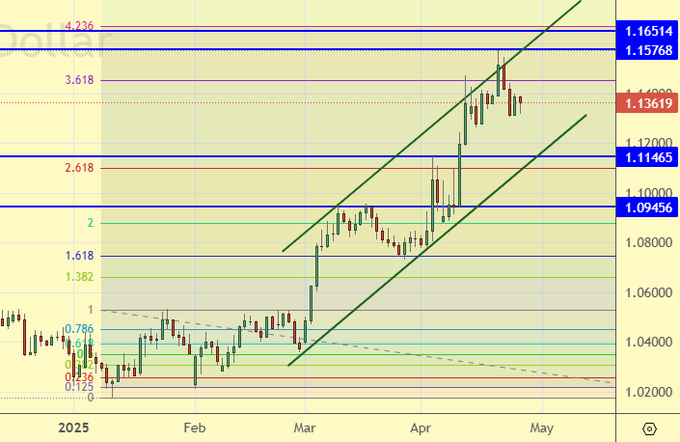
EUR/USD
Growth scenario: rain a pullback to 1.1000. Buying from current levels is uncomfortable.
Downside scenario: shorting from 1.1650 looks quite natural.
Recommendations on euro/dollar pair:
Buy: on a pullback to 1.1000. Stop: 1.0900. Target: 1.1650. Or on a pullback to 1.1150. Stop: 1.1100. Target: 1.1650.
Sell: when approaching 1.1650. Stop: 1.1720. Target: 1.0550.
Support — 1.1146. Resistance — 1.1576.
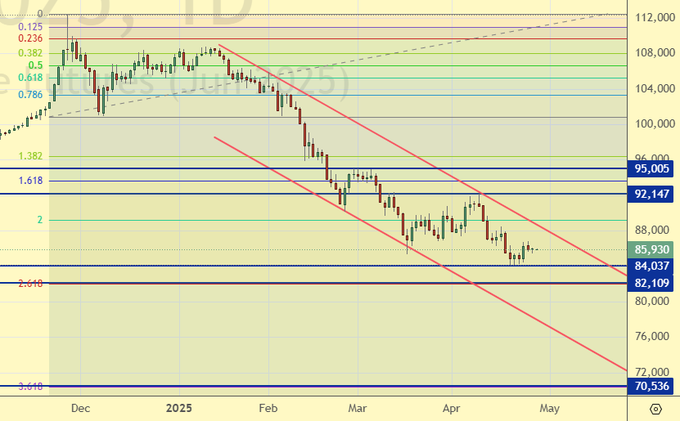
USD/RUB
Growth scenario: we consider June futures, expiration date June 19. From 82250 to buy unambiguously. While there are chances to touch this mark. In case of growth above 88000 there will be much less chances.
Downside scenario: uncomfortable to sell. Looking for opportunities in other markets.
Recommendations on dollar/ruble pair:
Buy: when approaching 82250. Stop: 81400. Target: 115000?! In case of growth above 88200. Stop: 85900. Target: 115000.
Sale: no.
Support — 84037. Resistance — 92147.
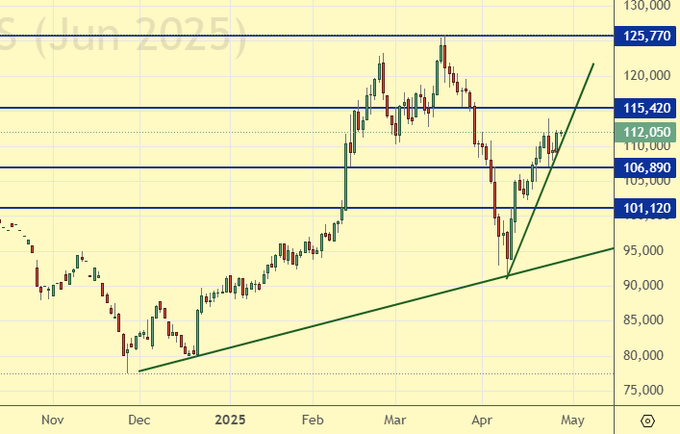
RTSI. MOEX
Growth scenario: we consider June futures, expiration date June 19. It is very hard to buy given the dark spots in foreign policy. Out of the market for now.
Downside scenario: “there will be an approach to 115000 — sell”. That’s what we wrote earlier. And you had such a chance last week. Let’s open positions down.
Recommendations on the RTS index:
Buy: no.
Sell: on approach to 115300. Stop: 117000. Target: 80000 (60000). Those who are in position from 114500, keep stop at 117000. Target: 80000 (60000). Count the risks!
Support — 106890. Resistance — 115420.
The recommendations in this article are NOT a direct guide for speculators and investors. All ideas and options for working on the markets presented in this material do NOT have 100% probability of execution in the future. The site does not take any responsibility for the results of deals.
