


Price forecast from 12 to 16 May 2025
You are an auto mechanic, ten years from now you are walking down the street, a man comes up to you and asks to see what happened to his car. There’s nothing written on you. All you have is your face. That’s what will be recognized by the camera glasses that are connected to the network. But some will hide their faces and their professions. Perhaps analysts will be among them.
Hi. Here’s to technical analysis in spite of the camera glasses!
This release was prepared with the direct participation of analysts from trading platforms eOil.ru and IDK.ru. Here is an assessment of the situation on the global and Russian markets.
Energy market:
So, the Indo-Pakistan incident lasted for three days. Wars cannot be fought by the poor and greedy. That’s exactly what happened there, or they realized they couldn’t afford it, “there’s no money”, or they were just stifled by greed. How much does it cost to fire one shot from a machine gun? Yeah, how much?
The US Fed left the rate at the same level of 4.25 — 4.5%. This gives stability, but does not give the bulls room to maneuver. Hopes that now the dollar value will become small and everything will go up again have not been justified yet, which means that there will be no excess demand for oil.
China’s economy has not yet gone down, but as soon as it does, and the hour is near, the Arabs, plus those who have joined them, will greatly regret having started to return to the market the volumes of oil withdrawn earlier. Yes, the shale oil producers in the US are really regretting that the oil market has not been able to consolidate above 75.00. The regret is already turning into a reduction in new well drilling activity. However, what the US loses in production will be made up for by OPEC and its plus.
Grain market:
Monday the 12th is a very important day. The WASDE report will be released, giving initial forecasts for the 25/26 season. The day before: both wheat and corn are in a vulnerable position. Further declines are possible. It is possible that the game plan is as follows: the report comes out, we put everything on the floor: wheat — 450.0, corn — 380.0, after that we start to grow in a wide channel as the reports about not too good situation in the fields come.
Even if, as the new season unfolds, it becomes clear that the global gross harvest will be excellent, in the neighborhood of 800 million tons, prices cannot fall indefinitely. Why? Because next year farmers will reduce their crops.
USD/RUB:
Can the rudder continue to strengthen? Yes, provided that the demand for imports continues to fall. and it is already falling. Elementary: they don’t buy new housing, they don’t make repairs, they don’t buy imported machinery. There is no demand for currency.
According to the budget rule, the Ministry of Finance will resume buying foreign currency. But 2.3 bln rubles per day from May 13 to June 5 may not be enough to collect the entire supply from the market.
In general, the rate of 80.00 does not suit the budget, as a barrel of oil in rubles costs almost 40% less than budgeted, but… the market. It still exists. Albeit crooked. But it is still there. There is a small probability of a move to 75.00 and 70.00. А 100? There’s still a question. With the rate of 21%, we can wait with this mark.
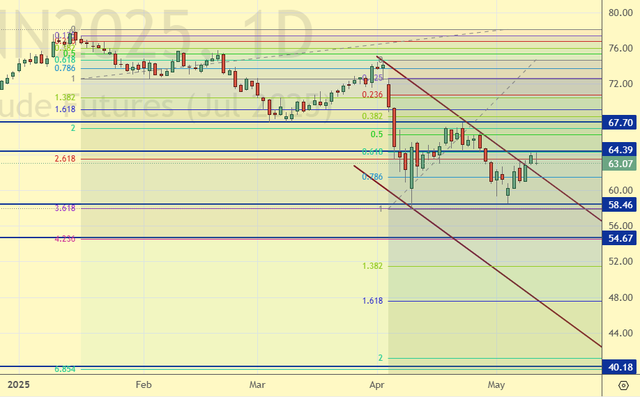
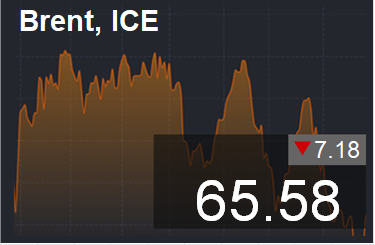
Brent. ICE
Let’s look at the open interest volumes for Brent. You should take into account that this is three days old data (for Tuesday of last week), and it is also the most recent data published by the ICE exchange.
At the moment there are more open long positions of asset managers than short ones. Over the past week the difference between long and short positions of asset managers decreased by 10.6 thousand contracts. We saw an outflow of sellers no buyers. The bulls are maintaining control.
Growth scenario: we consider June futures, expiration date May 29. We continue to stay out of the market.
Downside scenario: continue to hold shorts. Those who wish can increase their position at the current levels.
Recommendations for the Brent oil market:
Buy: no.
Sell: no. Who is in position from 72.51 and 71.10, keep stop at 67.60. Target: 54.70 (40.20?)
Support — 58.46. Resistance — 64.39.
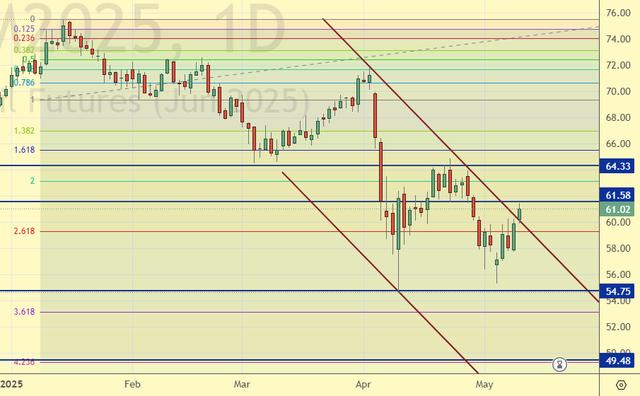
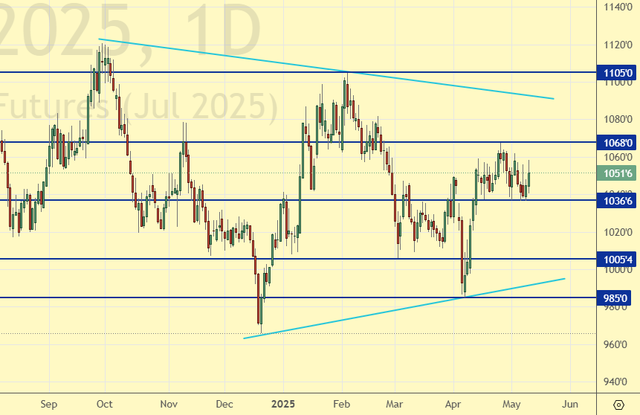
WTI. CME Group
US fundamental data: the number of active rigs decreased by 5 to 474.
U.S. commercial oil inventories fell -2.032 to 438.376 million barrels, with -1.7 million barrels forecast. Gasoline inventories rose 0.188 to 225.728 million barrels. Distillate stocks fell -1.107 to 106.708 million barrels. Cushing storage stocks fell by -0.74 to 24.961 million barrels.
Oil production fell by -0.098 to 13.367 million barrels per day. Oil imports rose by 0.558 to 6.056 million barrels per day. Oil exports fell by -0.115 to 4.006 million barrels per day. Thus, net oil imports rose by 0.673 to 2.05 million barrels per day. Oil refining rose by 0.4 to 89 percent.
Gasoline demand fell by -0.381 to 8.717 million barrels per day. Gasoline production rose by 0.253 to 9.71 million barrels per day. Gasoline imports rose 0.184 to 0.765 million barrels per day. Gasoline exports increased by 0.27 to 0.975 million barrels per day.
Distillate demand fell by -0.029 to 3.521 million barrels. Distillate production rose by 0.041 to 4.65 million barrels. Distillate imports rose 0.018 to 0.117 million barrels. Distillate exports rose 0.38 to 1.404 million barrels per day.
Demand for refined products increased by 0.718 million barrels to 19.872 million barrels. Production of petroleum products increased by 0.764 to 21.591 million barrels. Petroleum product imports rose 0.403 to 1.9 million barrels. Exports of refined products increased by 0.121 to 6.645 million barrels per day.
Propane demand rose 0.223 to 1.101 million barrels. Propane production fell -0.03 to 2.822 million barrels. Propane imports fell -0.004 to 0.086 million barrels. Propane exports fell -0.314 to 1.668 million barrels per day.
Let’s look at the WTI open interest volumes. You should take into account that this is three-day old data (for Tuesday of last week), and it is also the most recent data published by the CME Group exchange.
At the moment there are more open long positions of asset managers than short ones. During the past week the difference between long and short positions of asset managers decreased by 11.5 th. contracts. Buyers came to the market, but sellers did it as well, and in the volume twice as much as buyers. Bulls keep control.
Growth scenario: we consider June futures, expiration date May 20. Buying is not interesting. Out of the market.
Downside scenario: we will continue to hold shorts. Those who wish can increase shorts at current levels.
Recommendations for WTI crude oil:
Buy: no.
Sell: no. Who is in position from 69.72 and 68.00, keep stop at 64.30. Target: 49.48.
Support — 54.75. Resistance — 61.58.
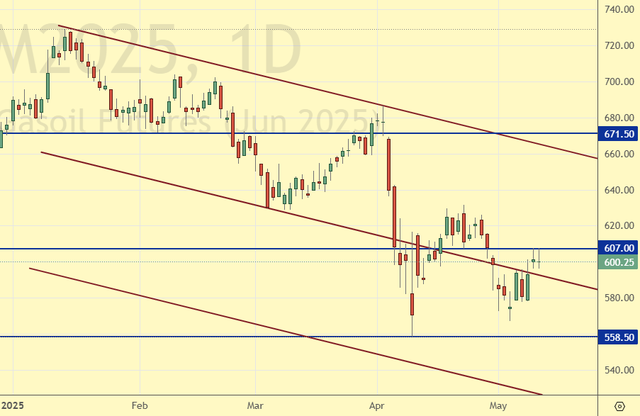
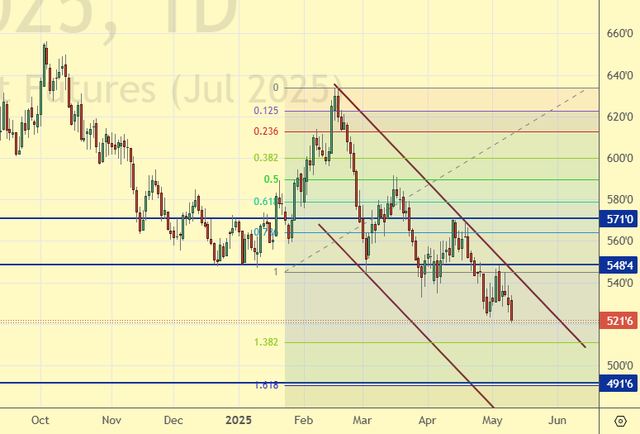
Gas-Oil. ICE
Growth scenario: we consider June futures, expiration date June 11. There is nowhere to buy. Out of the market. Only when approaching 420.0.
Downside scenario: we will continue to hold the short.
Gasoil Recommendations:
Buy: when approaching 420.0. Stop: 390.0. Target: 600.0.
Sell: no. Who is in position from 688.0 and 677.0, keep stop at 626.0. Target: 420.00.
Support — 558.50. Resistance — 607.00
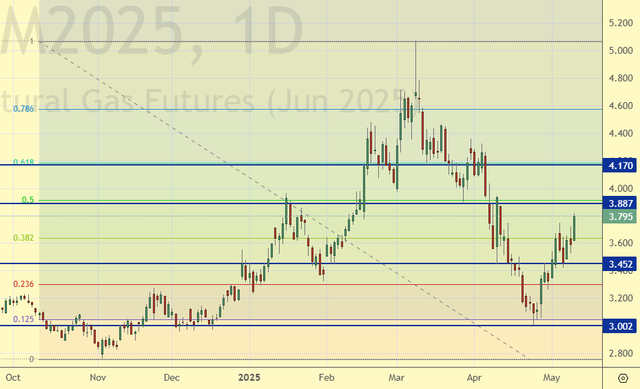
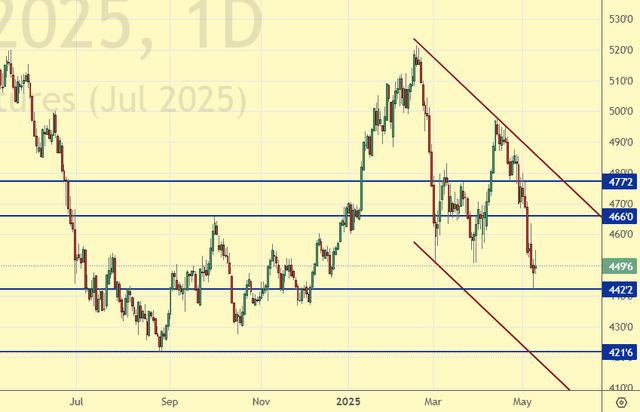
Natural Gas. CME Group
Growth scenario: we switched to the June futures, expiration date May 28. Purchases were justified. We hold long.
Downside scenario: we are not selling yet. Let Europe put gas in storage.
Natural Gas Recommendations:
Buy: no. Those in position from 3.114, move your stop to 3.322. Target: 6.000?!!!
Sale: no.
Support — 3.452. Resistance — 3.887.
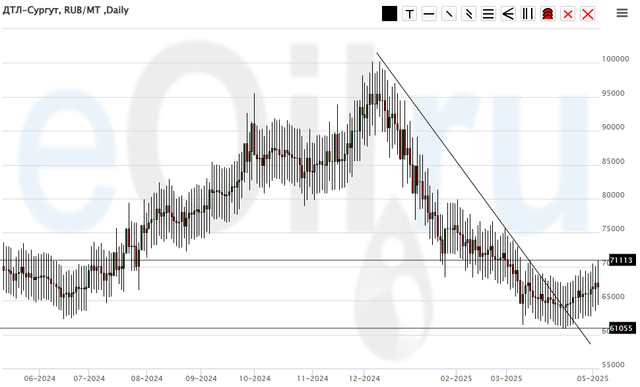
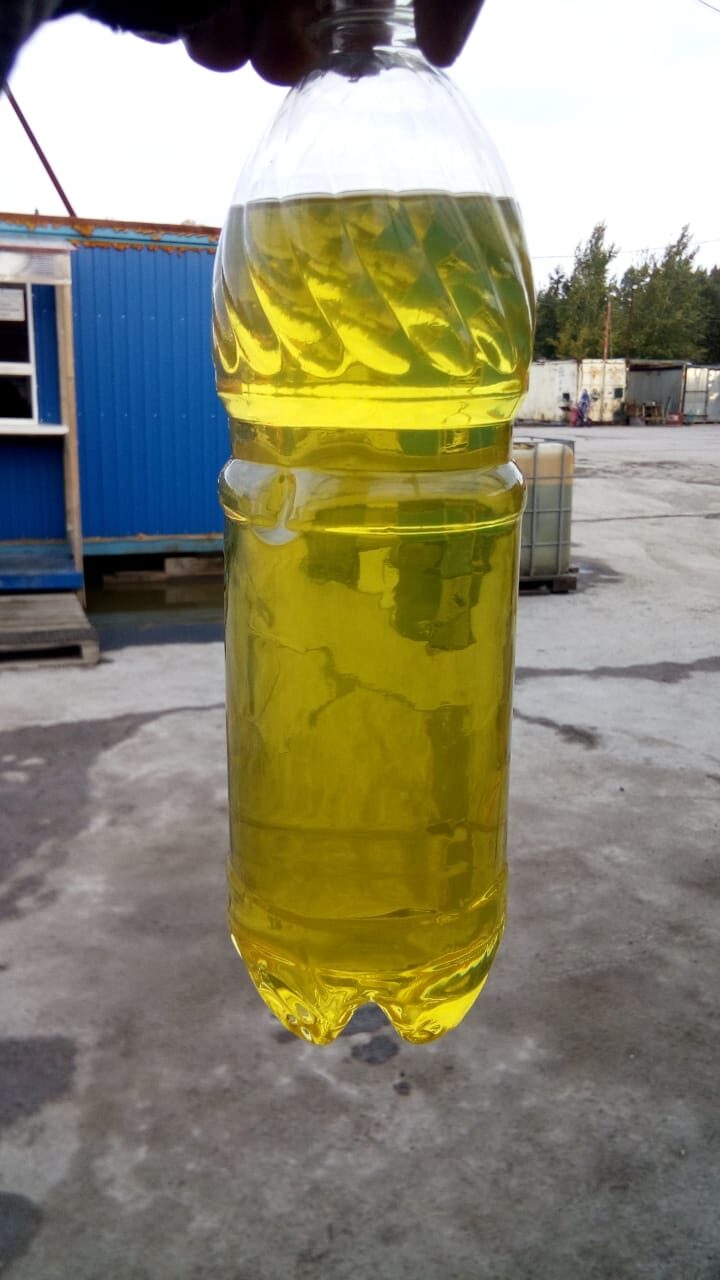
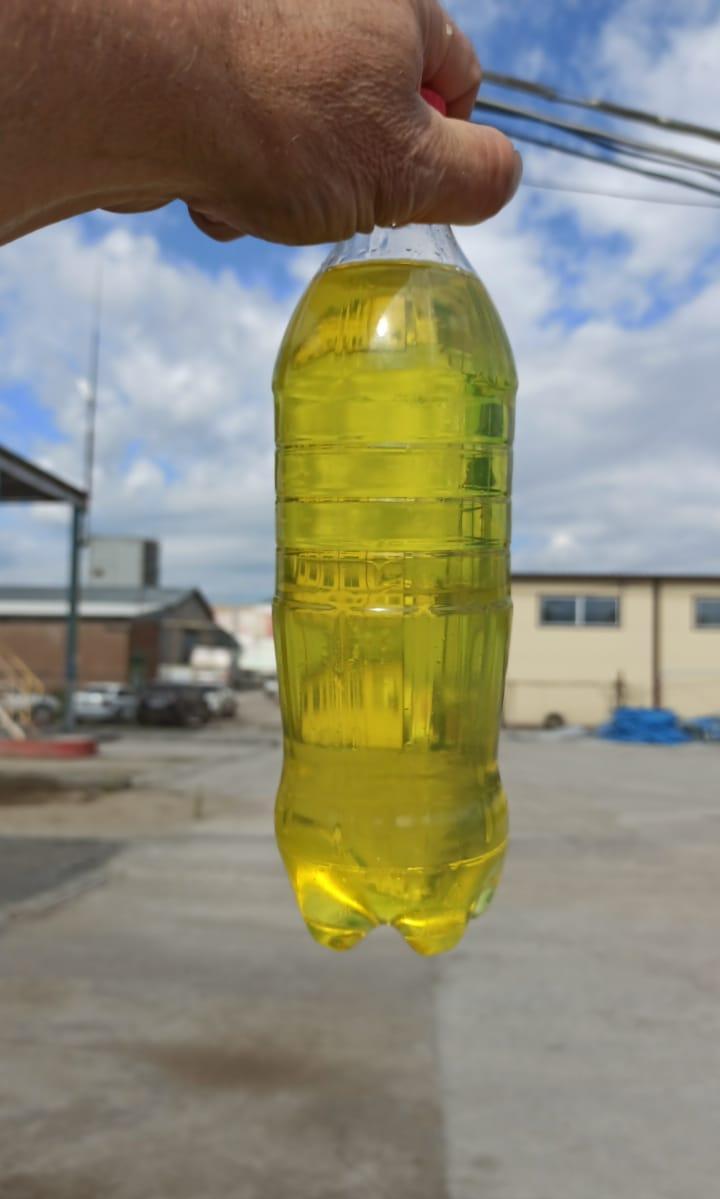
Diesel arctic fuel, ETP eOil.ru
Growth scenario: continue to recommend purchases. Bad things are happening to the budget. Fuel will be taxed (hypothesis).
Downside scenario: we will not sell anything. There is a constant risk of a sudden rise in prices.
Diesel Market Recommendations:
Buy: possible. Who is in position from 64000, keep stop at 59000. Target: 120000.
Sale: no.
Support — 61055. Resistance — 71113.
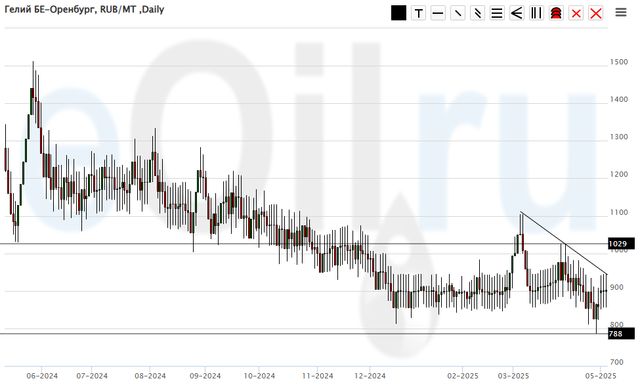
Helium (Orenburg), ETP eOil.ru
Growth scenario: waiting for growth above 1100. Sad market.
Downside scenario: stay out of the market, prices are low.
Helium market recommendations:
Buy: think after rising above 1100.
Sale: no.
Support — 788. Resistance — 1029.
Wheat No. 2 Soft Red. CME Group
Let’s look at the volumes of open interest in Wheat. You should take into account that this is three days old data (for Tuesday of last week), but it is also the most recent data published by CME Group.
At the moment there are more open short positions of asset managers than long ones. During the past week the difference between long and short positions of asset managers decreased by 6.3 th. contracts. There was an insignificant inflow of buyers. There were no sellers. Bears are controlling the situation.
Growth scenario: moved to July contract, expiration date July 14. You can buy from the area of 490.0. Further from 450.0. Only buying no selling.
Downside scenario: no interest in selling.
Recommendations for the wheat market:
Buy: after growth above 551.0. Stop: 539.0. Target: 700.0. When touching 492.0. Stop: 475.0. Target: 650.0.
Sale: no.
Support — 491.6. Resistance — 548.4.
Corn No. 2 Yellow. CME Group
Let’s look at the volumes of open interest in Corn. You should take into account that this data is three days old (for Tuesday of last week), it is also the most recent of those published by the CME Group exchange.
At the moment there are more open long positions of asset managers than short ones. During the past week the difference between long and short positions of asset managers decreased by 57.1 th. contracts. Sellers were coming to the market, buyers were closing positions. Bulls may lose control.
Growth scenario: switched to July contract, expiration date July 14. Buy only on pullbacks.
Downside scenario: you can keep shorts, but don’t give much space to the market.
Recommendations for the corn market:
Buy: now (449.6). Stop: 439.0. Target: 500.0.
Sell: no. Who is in the position from 492.2 (taking into account the transition to a new contract), move the stop to 457.2. Target: 380.0?!!!!!
Support — 442.2. Resistance — 466.0.
Soybeans No. 1. CME Group
Growth scenario: we consider the July contract, expiration date July 14. The pullback to 1000.0 can be used for long entry.
Downside scenario: you can keep shorts. However, on Monday be afraid of volatility growth.
Recommendations for the soybean market:
Buy: on a pullback to 1000.0. Stop: 990.0. Target: 1200.0?
Sell: no. Who is in position from 1059.2, keep stop at 1072.0. Target: 880.0
Support — 1036.6. Resistance — 1068.0.
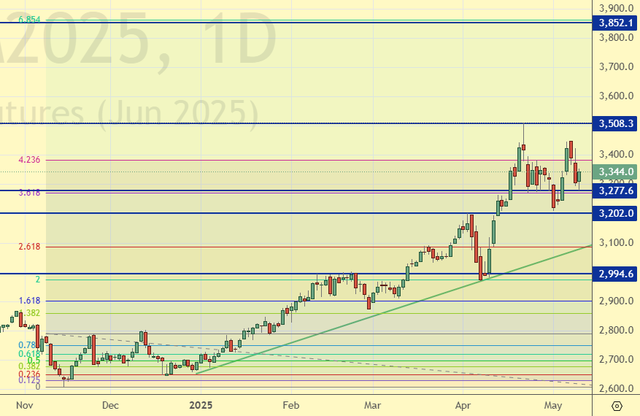
Growth scenario: we consider June futures, expiration date June 26. High volatility, which indicates a thin market. In such a situation, we should not discount the option of a move to 3850. Nevertheless, we would like to see a pullback to 3000 for buying.
Downside scenario: we can hope for prices to come down. But for now below 3000 the market is not visible.
Gold Market Recommendations:
Buy: no.
Sale: no.
Support is 3277. Resistance — 3508.
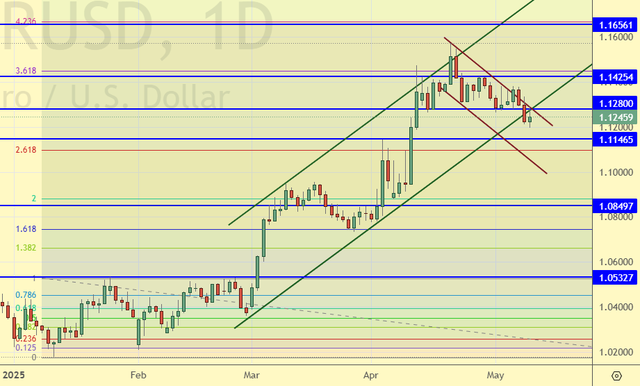
EUR/USD
Growth scenario: the pair has built back down. And that’s not good for the bulls. Don’t buy.
Downside scenario: we still haven’t gotten to 1.1650. This could lead to a move to 1.1000 and possibly lower. The US rate is higher than the EU rate.
Recommendations on euro/dollar pair:
Buy: no.
Sell: no. Those in position from 1.1298, move your stop to 1.1380. Target: 1.0000?!
Support — 1.1146. Resistance — 1.1280.
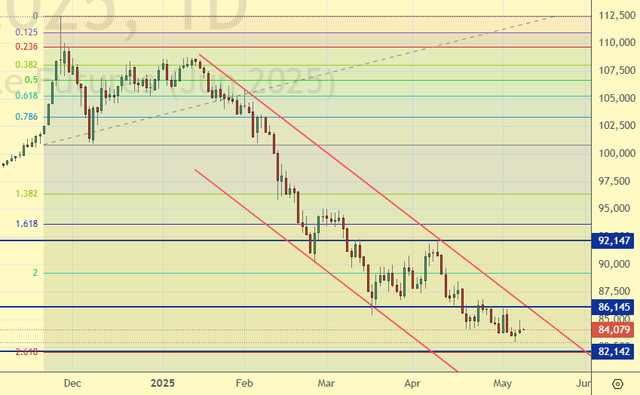
USD/RUB
Growth scenario: we consider June futures, expiration date June 19. We should wait for an upward reversal. The mark of 82200 looks weak. It may be broken down.
Downside scenario: uncomfortable to sell. Looking for opportunities in other markets.
Recommendations on dollar/ruble pair:
Buy: in case of growth above 86500. Stop: 84800. Target: 115000. Consider the risks.
Sale: no.
Support — 82142. Resistance — 86145.
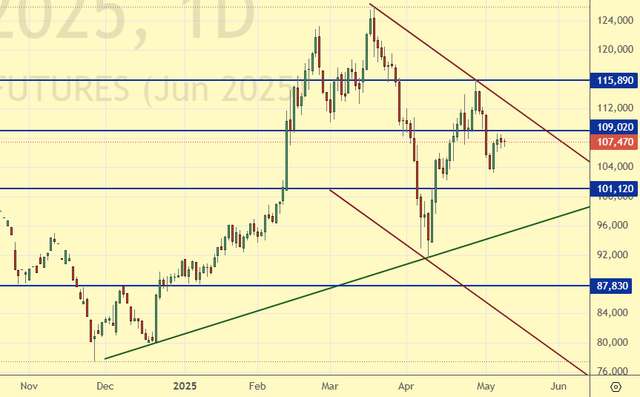
RTSI. MOEX
Growth scenario: we consider June futures, expiration date June 19. We continue to refuse to buy. Let’s go to 60000 and buy everything there!
Downside scenario: we should keep shorting. You can actually count on very deep marks. We live in a very gaunt, square world of large pixels, whereas before it was neat and the pixels were small. Now it’s just Trump and a few other figures around.
Recommendations on the RTS index:
Buy: no.
Sell: no. Who is in the position from 115300 and 114500, move the stop to 114200. Target: 80000 (60000).
Support — 101120. Resistance — 109020.
The recommendations in this article are NOT a direct guide for speculators and investors. All ideas and options for working on the markets presented in this material do NOT have 100% probability of execution in the future. The site does not take any responsibility for the results of deals.
